Hello everyone, i’m attempting to put a cluster to work using ec2 instances.
I launched 3 machines, and would like to put one zero in each one and 2 alphas, however, i’m facing some weird behaviour i’m not understanding. Questions following below.
10.30.0.191 (zero (leader))
10.30.0.180 (zero and alpha)
10.30.0.26 (zero and alpha (leader))
Zero → 6080/State:
{
    "counter": "1034",
    "groups": {
        "1": {
            "members": {
                "1": {
                    "id": "1",
                    "groupId": 1,
                    "addr": "10.30.0.180:7080",
                    "lastUpdate": "1607356083"
                },
                "2": {
                    "id": "2",
                    "groupId": 1,
                    "addr": "10.30.0.26:7080",
                    "leader": true,
                    "lastUpdate": "1607356282"
                }
            },
            "tablets": {
                "Album": {
                    "groupId": 1,
                    "predicate": "Album"
                },
                "Song": {
                    "groupId": 1,
                    "predicate": "Song"
                },
                "dgraph.acl.rule": {
                    "groupId": 1,
                    "predicate": "dgraph.acl.rule"
                },
                "dgraph.graphql.schema": {
                    "groupId": 1,
                    "predicate": "dgraph.graphql.schema"
                },
                "dgraph.graphql.xid": {
                    "groupId": 1,
                    "predicate": "dgraph.graphql.xid"
                },
                "dgraph.password": {
                    "groupId": 1,
                    "predicate": "dgraph.password"
                },
                "dgraph.rule.permission": {
                    "groupId": 1,
                    "predicate": "dgraph.rule.permission"
                },
                "dgraph.rule.predicate": {
                    "groupId": 1,
                    "predicate": "dgraph.rule.predicate"
                },
                "dgraph.type": {
                    "groupId": 1,
                    "predicate": "dgraph.type"
                },
                "dgraph.user.group": {
                    "groupId": 1,
                    "predicate": "dgraph.user.group"
                },
                "dgraph.xid": {
                    "groupId": 1,
                    "predicate": "dgraph.xid"
                },
                "type": {
                    "groupId": 1,
                    "predicate": "type"
                }
            },
            "checksum": "8242878090081052337"
        }
    },
    "zeros": {
        "1": {
            "id": "1",
            "addr": "localhost:5080"
        },
        "2": {
            "id": "2",
            "addr": "10.30.0.191:5080",
            "leader": true
        },
        "3": {
            "id": "3",
            "addr": "10.30.0.180:5080"
        }
    },
    "maxLeaseId": "8390000",
    "maxTxnTs": "150000",
    "maxRaftId": "2",
    "cid": "08104978-e707-487e-8090-22201fb88506",
    "license": {
        "maxNodes": "18446744073709551615",
        "expiryTs": "1609105755",
        "enabled": true
    }
}
- Why zero ID:1 is localhost:5080?
So I just requested /health?all alphas: 10.30.0.26:7080 and 10.30.0.180:7080
//10.30.0.180:7080
[
    {
        "instance": "zero",
        "address": "10.30.0.191:5080",
        "status": "healthy",
        "group": "0",
        "version": "v20.07.2",
        "uptime": 6013,
        "lastEcho": 1607358147
    },
    {
        "instance": "alpha",
        "address": "10.30.0.26:7080",
        "status": "healthy",
        "group": "1",
        "version": "v20.07.2",
        "uptime": 2050,
        "lastEcho": 1607358147
    },
    {
        "instance": "zero",
        "address": "10.30.0.180:5080",
        "status": "healthy",
        "group": "0",
        "version": "v20.07.2",
        "uptime": 5430,
        "lastEcho": 1607358147
    },
    {
        "instance": "zero",
        "address": "10.30.0.180:5080",
        "status": "healthy",
        "group": "0",
        "version": "v20.07.2",
        "uptime": 5430,
        "lastEcho": 1607358147
    },
    {
        "instance": "alpha",
        "address": "10.30.0.180:7080",
        "status": "healthy",
        "group": "1",
        "version": "v20.07.2",
        "uptime": 1797,
        "lastEcho": 1607358147,
        "ongoing": [
            "opRollup"
        ],
        "ee_features": [
            "backup_restore"
        ]
    }
]
- Why do I have 2 zeros with same IP here? 10.30.0.180:5080?
//10.30.0.26:7080
[
    {
        "instance": "zero",
        "address": "10.30.0.26:5080",
        "status": "healthy",
        "group": "0",
        "version": "v20.07.2",
        "uptime": 3583,
        "lastEcho": 1607358240
    },
    {
        "instance": "zero",
        "address": "10.30.0.180:5080",
        "status": "healthy",
        "group": "0",
        "version": "v20.07.2",
        "uptime": 5522,
        "lastEcho": 1607358240
    },
    {
        "instance": "zero",
        "address": "10.30.0.191:5080",
        "status": "healthy",
        "group": "0",
        "version": "v20.07.2",
        "uptime": 6105,
        "lastEcho": 1607358240
    },
    {
        "instance": "alpha",
        "address": "10.30.0.180:7080",
        "status": "healthy",
        "group": "1",
        "version": "v20.07.2",
        "uptime": 1888,
        "lastEcho": 1607358240
    },
    {
        "instance": "alpha",
        "address": "10.30.0.26:7080",
        "status": "healthy",
        "group": "1",
        "version": "v20.07.2",
        "uptime": 2144,
        "lastEcho": 1607358240,
        "ongoing": [
            "opRollup"
        ],
        "ee_features": [
            "backup_restore"
        ]
    }
]
- Here 3 zeros with distinct IP’s here, seems ok, but, what about question 2?
That is the cluster when I navigated over ratel (I suppose it uses the same endpoints above, huh)

- How am I able to know which alpha should I point in order to run query against it? I Just realized if I connect via ratel in alpha 10.30.0.26:8080 (which is the leader) it returns me nothing, also, the Schema is missing too many predicates.
schema: 10.30.0.26:8080
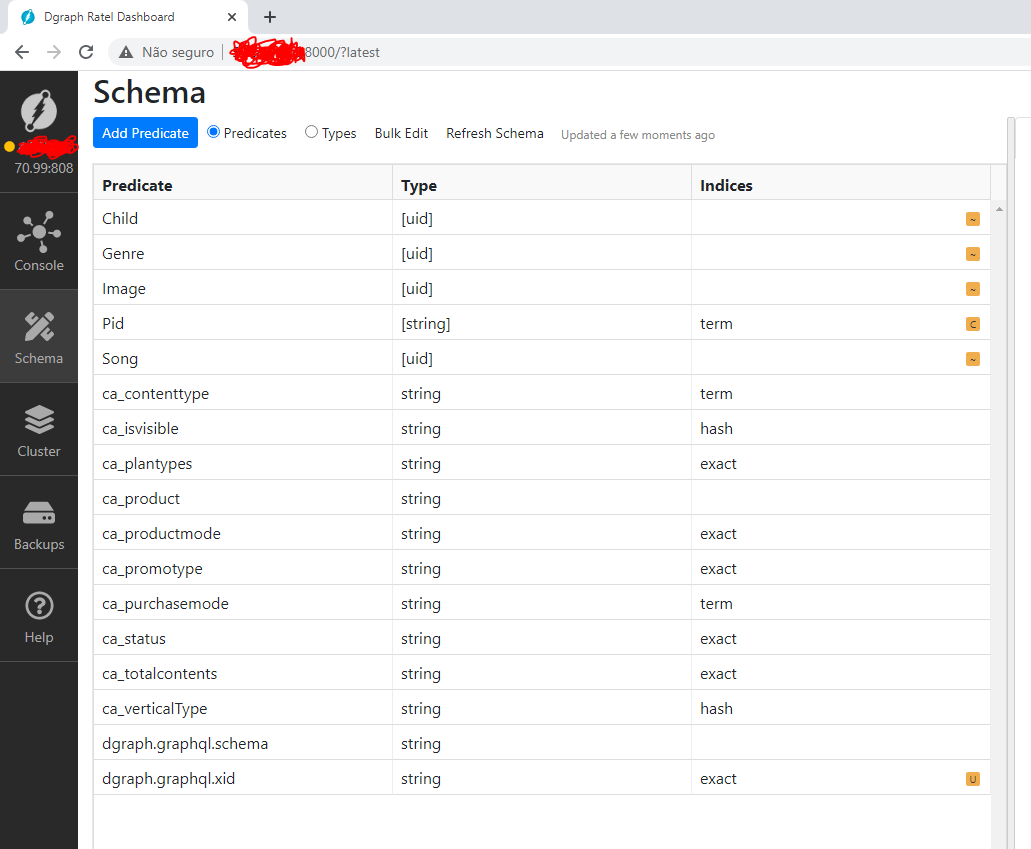
schema: 10.30.0.180:8080

Also, there is a last thing that would block my usage of dgraph in a prod environment.
- After a bulk load of a 10GB rfd file, (around 47M items), whenever an alpha goes down, and a new one is started or becoming a leader, does it rebuild ALL the indexes? is it a expected behaviour? It is taking so long